How to create a monitor
To create a new monitor, you will need an Odown account. If you don't have one yet, you can start a free trial.
After logging in, click the New Monitor button on the monitors page.
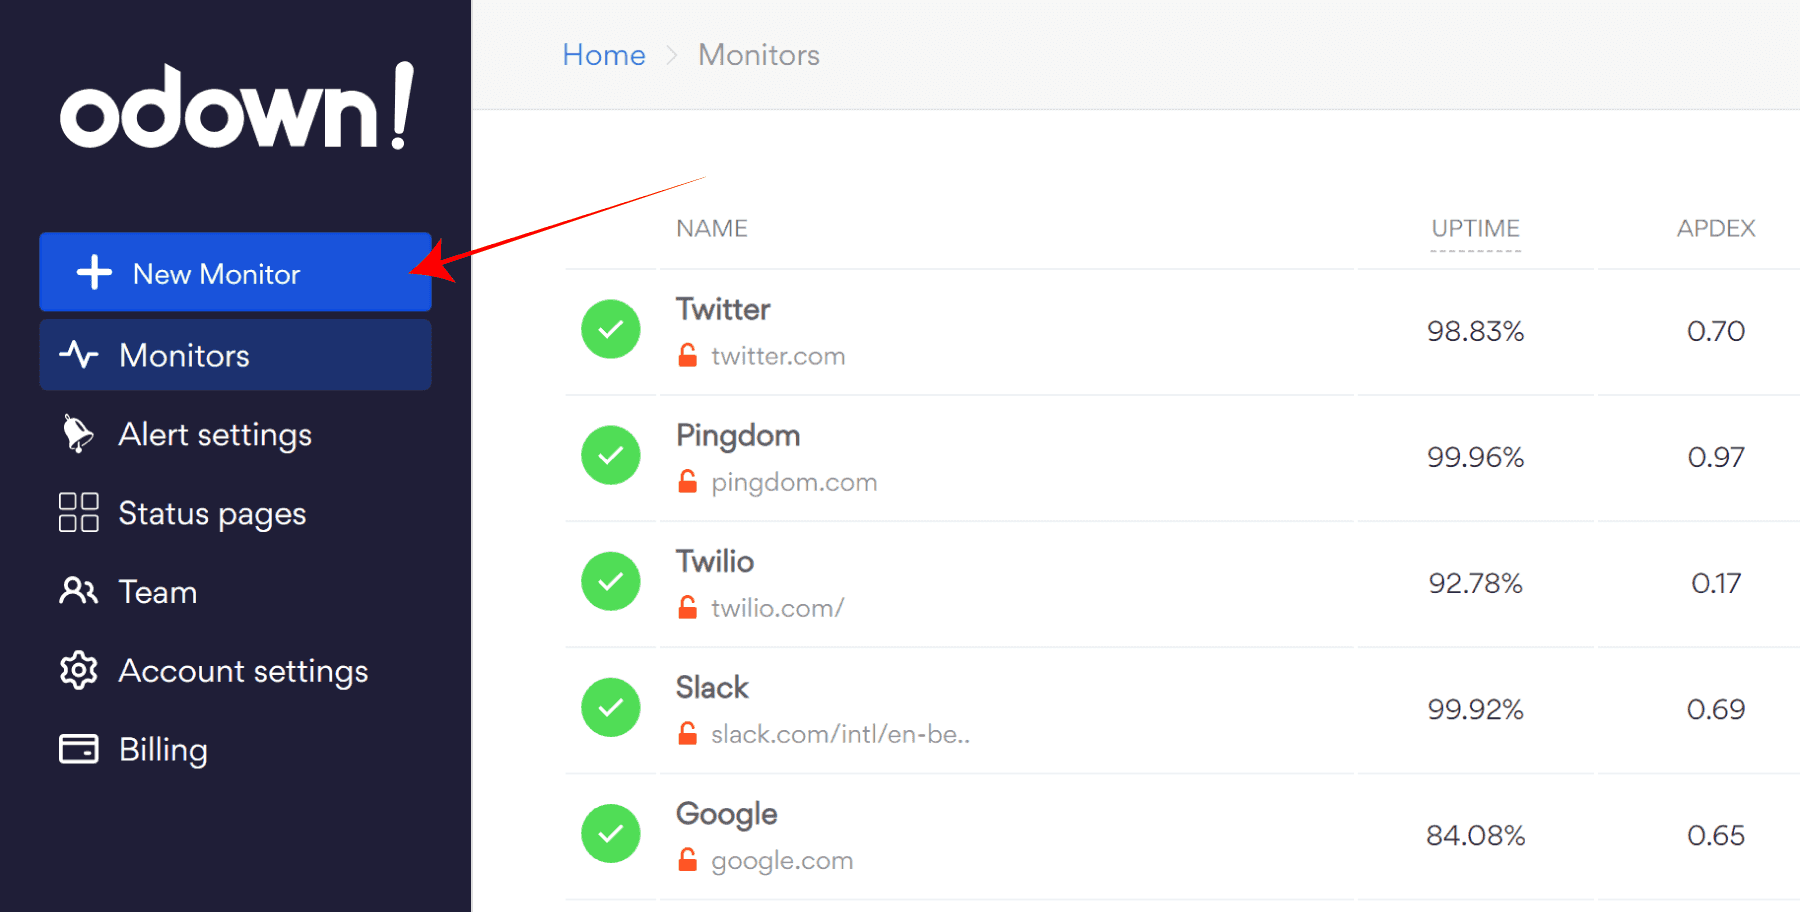
This opens the monitor form. Only the name and URL are required; everything else has a sensible default.
Name and URL
Give the monitor a name you will recognise in alerts (for example "Website" or "Payments API") and enter the full URL, including https://.
HTTP request settings
Choose the HTTP method: GET (the default), POST, PUT, HEAD, DELETE, PATCH or OPTIONS.
- GET fetches the page or resource and is the right choice for most websites and API health endpoints.
- HEAD returns the headers only. It is lighter, but you can't check the response body with it.
- POST, PUT, PATCH and DELETE let you test endpoints that expect them. Use them carefully: a monitor sends the request on every check, so point them at endpoints where repeating the request is harmless.
You can also choose whether to follow HTTP 3xx redirects (on by default).
Headers and body (optional)
Under Header, add any request headers the endpoint needs, such as Authorization for an API token or Accept. Under Body, send no body, form parameters, JSON or raw text.
Expected status code
By default, any 2xx response counts as up. You can instead require an exact status code (for example 200 or 204) or accept anything below 500.
Expected body (optional)
Enter up to 200 characters, for example {"status": "OK"}. The check only passes if the whole response body is exactly this text, so use it for small health-check endpoints rather than full HTML pages.
Locations
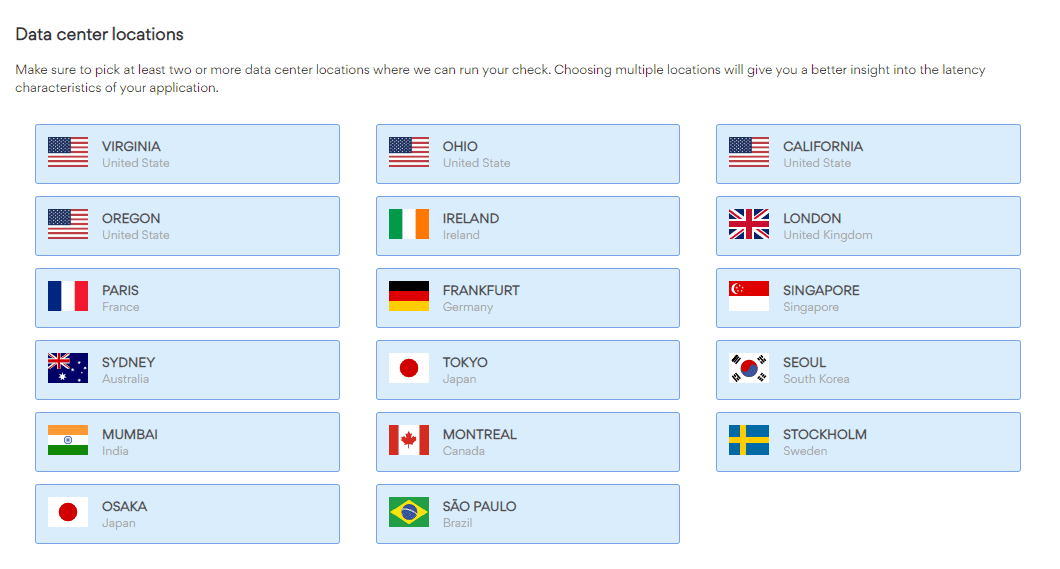
Pick the data center locations to check from. A new monitor starts with one location selected; we recommend two or more. Each check runs from one of the selected locations, rotating through them, so over time you see response times from every region you chose. You need at least one location.
Confirmation thresholds
To avoid alerts for one-off blips, Odown retries a failed request and only marks a monitor as down after several failed checks in a row.
- Confirm down after (failed checks): between 1 and 10, 3 by default.
- Confirm recovery after (successful checks): 2 by default.
Set the down threshold to 1 if you want to be alerted on the first failed check.
Response time limits
The threshold (500 ms by default) is the response time you consider good. Odown uses it to calculate the monitor's APDEX score: responses under the threshold count as satisfied, responses up to four times the threshold as tolerated, and slower ones as frustrated. Response times are recorded for every check, but alerts are sent when checks fail, not when they are slow.
Schedule
Choose how often to check: every 1, 5, 10, 15 or 30 minutes, or every 1, 6, 12 or 24 hours. The default is every minute.
Alert channels
New alert channels are added to every monitor automatically. In this section you can turn a channel off for this monitor, or choose which alert types it gets for this monitor.
Finalize and save
Click Save New Monitor. You will be taken to the monitor's detail page, which shows its uptime, response times and recent checks.